
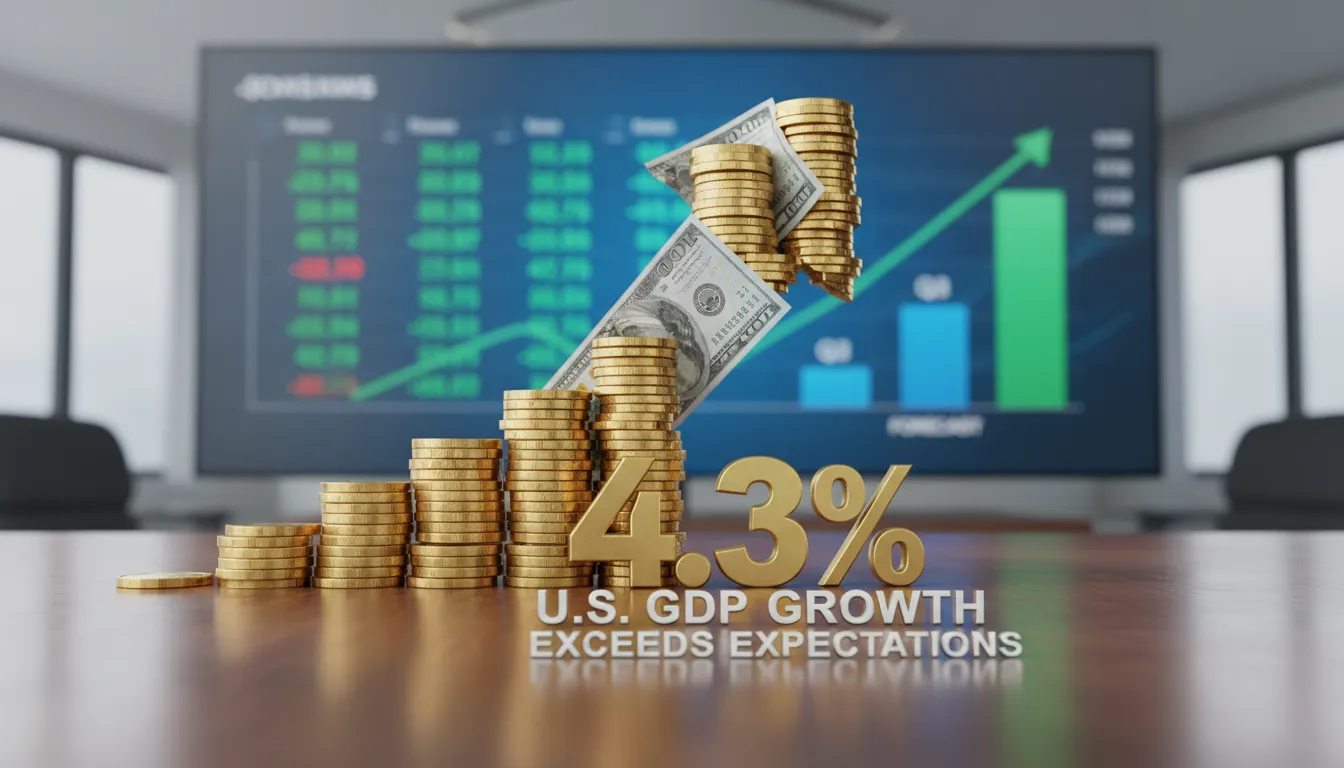
U.S. Economy Defies Gravity: Q3 GDP Surges 4.3%, Shattering Market Consensus
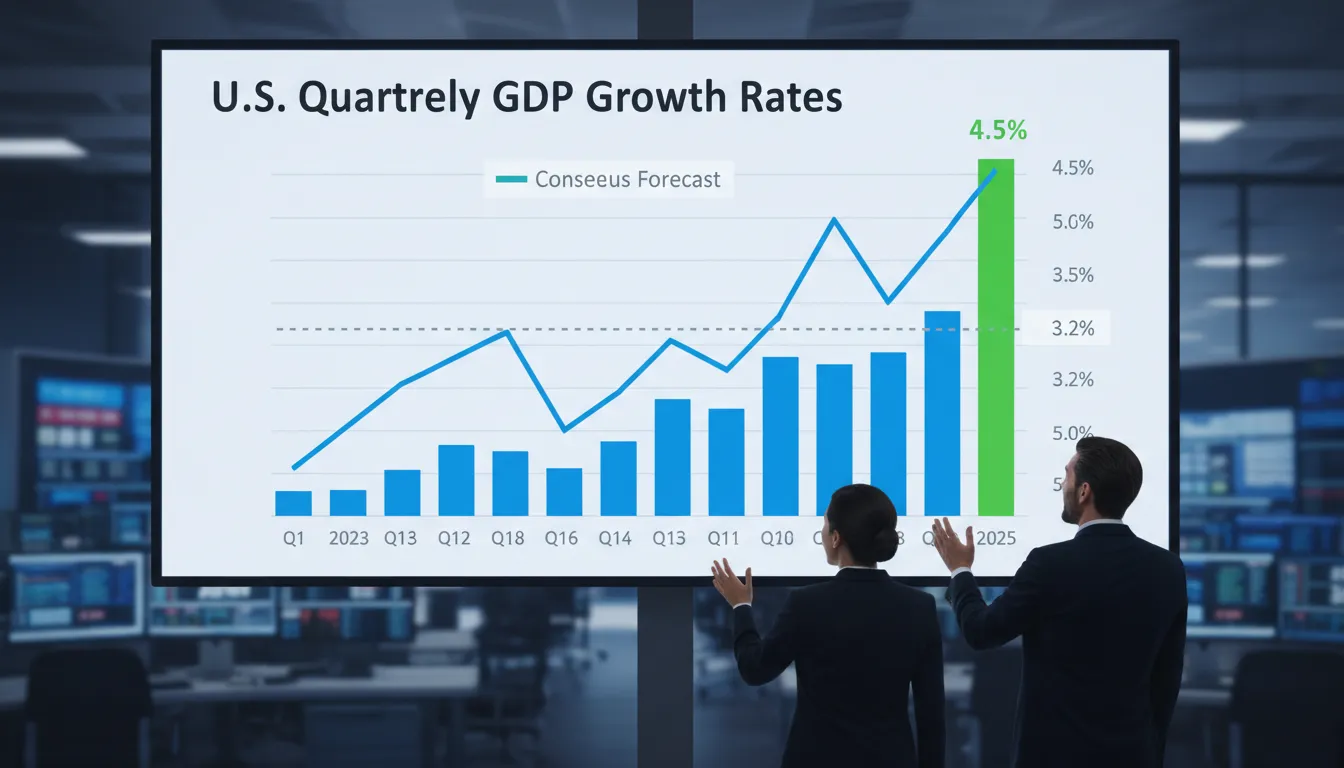
The United States economy has delivered a stunning performance in the third quarter of 2025, expanding at an annualized rate of 4.3%. This figure, released by the Bureau of Economic Analysis (BEA) after a significant delay caused by the recent government shutdown, completely upended market consensus, which had pegged growth at a more modest 3.2%. Far from the cooling trajectory many analysts predicted, the data signals a resurgence in economic activity driven by an unyielding consumer and favorable trade dynamics, even as business investment shows signs of fatigue.
The Core Drivers: Consumption and Trade
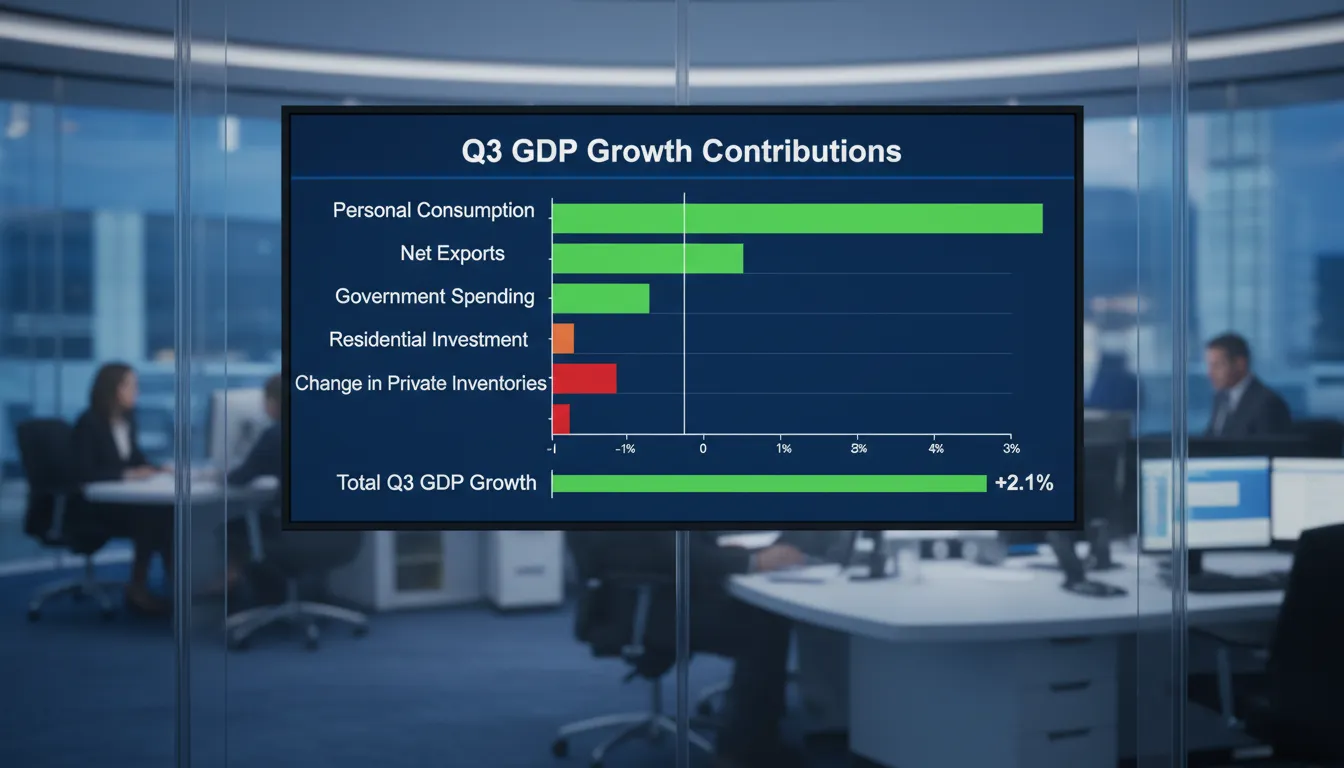
The headline figure of 4.3% is impressive, but the composition of this growth tells a more nuanced story about the health of the American economy. The expansion was not broad-based across all sectors but was heavily reliant on two specific pillars: resilient household spending and a shifting trade balance.
Consumer Spending Remains the Bedrock
Personal consumption expenditures (PCE) surged by 3.5%, accelerating from the previous quarter. Despite inflationary pressures and high borrowing costs, American households continued to spend aggressively, particularly on services. Healthcare, international travel, and recreational services were the primary beneficiaries. This resilience challenges the “recessionary” narrative that has plagued market sentiment for much of 2025. However, with the savings rate dipping further, questions remain about the sustainability of this spending spree into 2026.
The Net Export Anomaly
A significant portion of the GDP “beat” came from net exports. Exports rebounded sharply, growing at an 8.8% clip, driven by strong demand for U.S. industrial supplies and capital goods. Conversely, imports fell by 4.7%, a decline that mathematically boosts the GDP calculation but often signals weaker domestic demand for foreign goods. This divergence—rising exports and falling imports—added approximately 1.6 percentage points to the headline growth figure, a boost that may be temporary as global supply chains normalize.
Investment and Inflation: The Warning Signs
While the topline number suggests a boom, the underlying investment data offers a sobering counter-narrative. Gross private domestic investment retreated, with residential investment falling 5.1%. This marks the second consecutive quarter of decline in the housing sector, a direct casualty of mortgage rates that remain elevated.
Furthermore, the inflation data embedded in the report complicates the Federal Reserve’s path forward. The core PCE price index—the Fed’s preferred inflation gauge—rose to 2.9%, stubbornly above the 2% target. This persistence suggests that while growth is robust, the “last mile” of the inflation fight is proving difficult, potentially delaying the aggressive rate cuts markets have priced in for early 2026.
Data Breakdown: Q3 2025 Performance vs. Expectations
The following table illustrates the divergence between market forecasts and the actual economic data released by the BEA.
| Metric | Q3 2025 Actual | Market Consensus | Q2 2025 (Previous) |
|---|---|---|---|
| Real GDP Growth (Annualized) | 4.3% | 3.2% | 3.8% |
| Consumer Spending (PCE) | 3.5% | 2.7% | 2.5% |
| Core PCE Inflation | 2.9% | 2.9% | 2.6% |
| Residential Investment | -5.1% | -4.0% | -5.1% |
| Exports | +8.8% | +2.5% | -1.8% |
Strategic Implications for U.S. Stakeholders
Federal Reserve Policy Outlook
This report puts the Federal Reserve in a bind. A 4.3% growth rate is hardly consistent with an economy that needs lower interest rates to survive. However, the weakness in the housing market and the reliance on volatile trade numbers may give the Fed cover to proceed with caution. The market is currently pricing in a “hold” for the January meeting, with the first potential cut pushed to March or May 2026.
Corporate Earnings
For corporate America, the data is a green light for consumer-facing sectors. Companies in travel, hospitality, and healthcare are likely to report strong Q4 earnings based on this momentum. However, firms tied to the housing market or heavy capital expenditure (CapEx) may face headwinds as business investment continues to drag.
Frequently Asked Questions (FAQ)
Why was the Q3 GDP data released so late?
The release was delayed due to the 43-day federal government shutdown that occurred earlier in the quarter. This backlog forced the Bureau of Economic Analysis (BEA) to postpone its standard release schedule, resulting in this “initial” estimate arriving in December rather than October.
Does 4.3% growth mean inflation is coming back?
Not necessarily, but it is a risk. The 2.9% core PCE reading indicates that price pressures are sticky. High demand (indicated by strong GDP) can keep prices elevated, making it harder for the Fed to bring inflation down to its 2% target quickly.
Is a recession still possible in 2026?
Yes. While Q3 was strong, the “K-shaped” nature of the recovery—where services boom while housing and manufacturing struggle—leaves the economy vulnerable. If the labor market softens or consumer savings run dry, the economy could decelerate rapidly in the first half of 2026.
Final Outlook
The Q3 GDP print of 4.3% is a testament to the structural resilience of the U.S. economy. It effectively kills the near-term “hard landing” thesis but replaces it with a “no landing” scenario that carries its own risks—namely, higher-for-longer interest rates. For investors and business leaders, the key takeaway is to remain exposed to the U.S. consumer but cautious on interest-rate-sensitive sectors like real estate and heavy industry. The economy is running hot, but the engine is relying heavily on specific cylinders to maintain this speed.